
Most website owners have spent the couple minutes installing Google Analytics on their website. But when was the last time you actually looked at the Analytics dashboard? What did you learn from that?
If you’re like most business owners I’ve talked to, you haven’t opened up google.com/analytics since you installed it. Or, if you did open it up, you weren’t too sure what all the numbers meant or what you were supposed to do with that information.
In this post, I’ll show you how to access actionable data with Google Analytics so you can improve your site and get a better understanding of how it’s performing.
Before we begin, have you seen the new Analytics dashboard?
Not too long ago, Google Analytics updated their main dashboard (or “Google Analytics Home”) with more user-friendly wording and graphs. Right away, you can see how you’re acquiring new visitors, what pages they’re visiting the most, and what devices they’re using.
This new dashboard is definitely more approachable than the old version. However, there’s still some verbiage that might confuse new analytics users (“what is organic search? direct? referral? hmm…”) but you could glean some helpful information out of this page.
Have you tried the new “Intelligence” tool?

That’s right, Google Analytics is intelligent now! ?
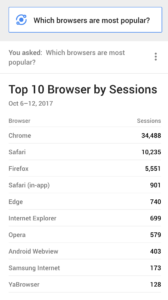
On the main dashboard, there’s a button to open the new Intelligence panel that lets you type in questions about your site data and get answers. For example, you can ask for the most popular browsers used to access your website and get an immediate chart.
Now that we’ve explored the new dashboard and Intelligence feature, let’s dive into some data to answer important questions about your site.
Are visitors running into broken links, 404 errors, or pages that don’t exist?
One way to ruin the visitor experience on your website is having a broken link that goes nowhere! Screeeech you’ve brought their websurfing to a halt!
There are a lot of ways that you could have links to pages that don’t exist anymore. With Analytics, you can find out where these links are and what the links are pointing to. This also includes external links (other peoples’ websites) that are pointing to non-existent pages!
How to do it!
- On the left sidebar, press on Behavior > Site Content > All Pages
- In the search bar above the table, type in 404 then hit the search icon
- Press on the Secondary dimension dropdown above the table, then Behavior > Full Referrer
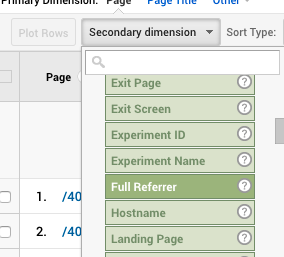
You’ll now see a list of the 404 errors that visitors have run into on your website. If you have a WordPress website, it should be formatted as /404.html?page=/page-title-here/&from=/another-title-here/
The page URL that comes after from= is the page that’s pointing to the broken link, and the page= part is the URL it’s pointing to. Within your website, you can now edit the “from” page and fix up the link.
If it’s a link from someone else’s website, you’ll see the offending page in the “Full Referrer” column. You have a couple options when this happens.
The first option would be to reach out to that website’s owner and ask that they change the URL (and include the right URL they should link to).
The alternative would be to set up a 301 redirect from the broken link to the correct page. If you’re using a WordPress website, here’s a guide for setting up a 301 redirect. This will make it so that the broken link starts working and redirecting visitors to the right page.
Be sure to fix up all your broken links! Leaving these on your site will frustrate users and goof up your search engine optimization.
How is your contact form performing?
The performance of your contact page can be defined in many different ways: the percentage of total visitors, the percentage of visitors that view product/service pages first then click onto a CTA (call-to-action), the percentage of visitors that visit the contact page, and so on.
For our purposes today, we’re going to look at the number of people that visited the contact page then submitted the form. Here are a couple things to consider:
- The proper setup of this would be to configure a Goal for the contact form, which gives you greater insights into the conversion rate. However, we’re going to use the raw data this time around.
- Your contact form should redirect to a “Thank you” page so it’s easier to track the conversion rates within Google Analytics.
How to do it!
- On the left sidebar, go to Behavior > All Pages
- Search for the name of your contact page then click on its path in the search results
- On the top of this page, press the “Navigation Summary” tab
- In the “Next Page Path” table, you’ll see your thank you page listed there. Your “% Pageviews” is your conversion rate for your contact form.
From here, you can use the date range at the top of the screen to compare the percentage to different weeks/months and see how the form has been converting over time.
In reality, it’s better to track the number of conversions of total visitors rather than just those that visit your contact page. This can be done by going to Behavior > All Pages then seeing the percentage of “Pageviews” for the Thank You page in that table.
However, if 0% of your Contact Page visitors are filling out your contact form, that’s definitely something you want to look into. (Hint: as a first step, test the form yourself to make sure it’s actually working…!)
Which social media channels are sending the most traffic?
After all of those hours writing witty tweets and Facebook posts, how is your traffic being affected by your social media efforts?
How to do it!
- On the left sidebar, go to Acquisition > Channels
This table will show you what percentage of your site’s traffic is being received from social networks. You can also press on “Social” to see a breakdown per-social network.
Keep in mind that these numbers include social traffic from other peoples’ posts about your company as well, so it could be that your own social media efforts aren’t generating any website visits but other people are talking about you on their pages and sending traffic.
To better track your own social networking efforts, I’d recommend setting up UTM codes when you share URLs.
Explore Google Analytics
We answered just a few questions in a couple short clicks of the mouses or taps on the tablet. Google Analytics holds a treasure trove of data that you can use to make inferences about changes you should make to your site or what kind of content you should be writing.
Don’t be afraid to click around and explore all of the tabs!
Comment below!
- What’s the most interesting thing you’ve found in your Google Analytics account?
- What questions would you want help answering for your own site?