If a website is only seeing 10 visitors a day, exploring visitor stats through Google Analytics can be boring and unnecessary. It’s true – at that point, the dataset isn’t large enough to make rational judgment calls about what needs to be change don the site and how to get more people converting or accomplishing business goals. But when dealing with a site that has substantial traffic flowing through the pages regularly, the real fun work begins.
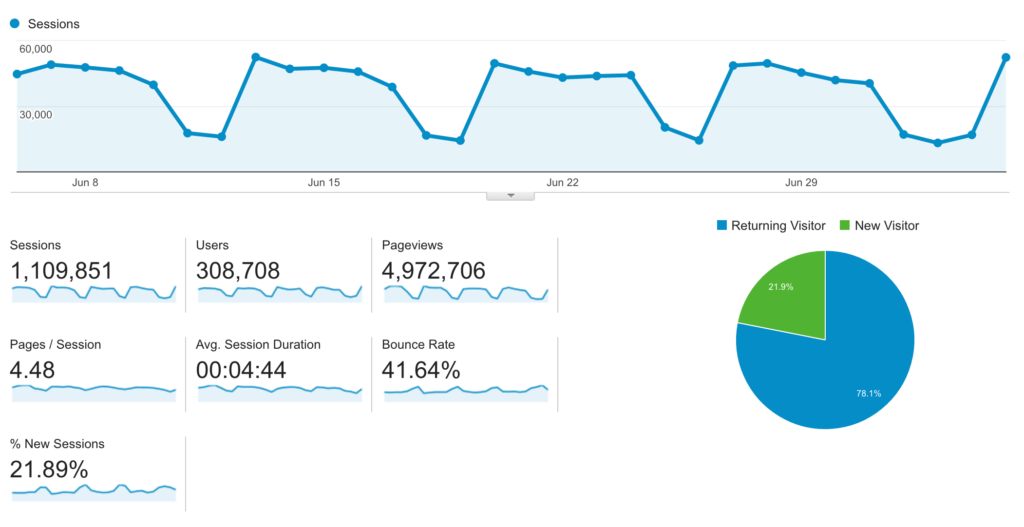
We maintain and develop some really high-traffic sites. Today we’ll be exploring an ad-supported blog that receives 1 million pageviews per week on average. The goal of this site is to (1) direct the user to the content they are interested in, and (2) get the most pageviews (aka ad revenue) per visitor possible.
In this post, we’ll explore the statistics, ask a question about visitor behavior, answer the question through the available data and segmenting options, then make recommendations for what changes to the site can be made & further analyzed. In future posts, we can review the effects of our changes to see how things turned out.
What are visitors doing after hitting the homepage?
Around 57% of visitors hit the homepage first before any other page, while almost all other visitors using links (shared through social or links via other sites) to specific posts. The visitors hitting the homepage are going to start seeking out content to view through the category navigation listed at the top of the page or they will click on a post directly.
The question:
“Are more pageviews generated when a visitor clicks onto a post or onto a category link right after hitting the homepage?”
There’s a couple caveats to this question:
- If a visitor hops from homepage > category > post rather than homepage > post, that will of course generate one additional view… But not all visitors who click on the category page will open a post.
- While increasing pageviews (and thus ad revenue) is a focus for this client, avoiding user frustration and anger is a secondary goal. The fans of this site are loyal and come back regularly, but they are very vocal and will express their annoyance with any site feature that they don’t like through social media or emailing the owners directly. Making the visitor go through hoops to view their content just to increase ad revenue isn’t desired.
The data & setup:
We’ll need to create one segment for visitors that go from the homepage to a category and another segment for visitors that go straight to a post. This site’s URL/permalink structure for posts is “/yyyy/mm/post-title/” and categories are within “/category/”, which will make it easier to create these segments.
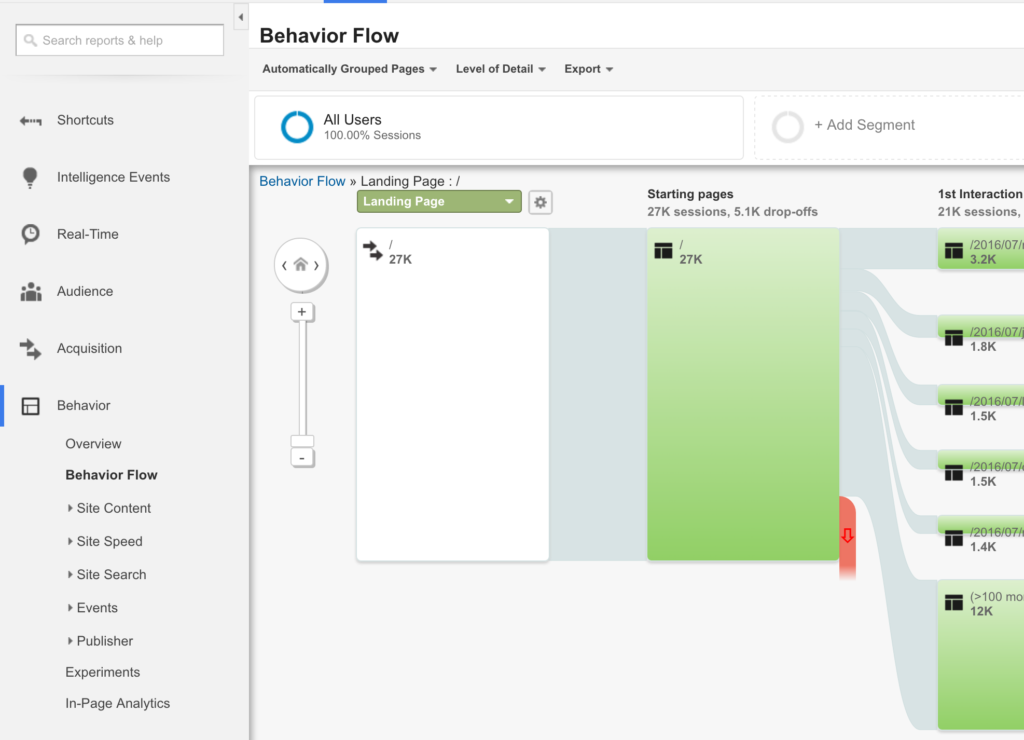
To make sure the segments are set up properly, I’m setting up the segments on the Behavior Flow page. This page shows you how visitors are going from their first to last pageview on the site.
Here’s what the configured segment looks like for Homepage > Post:
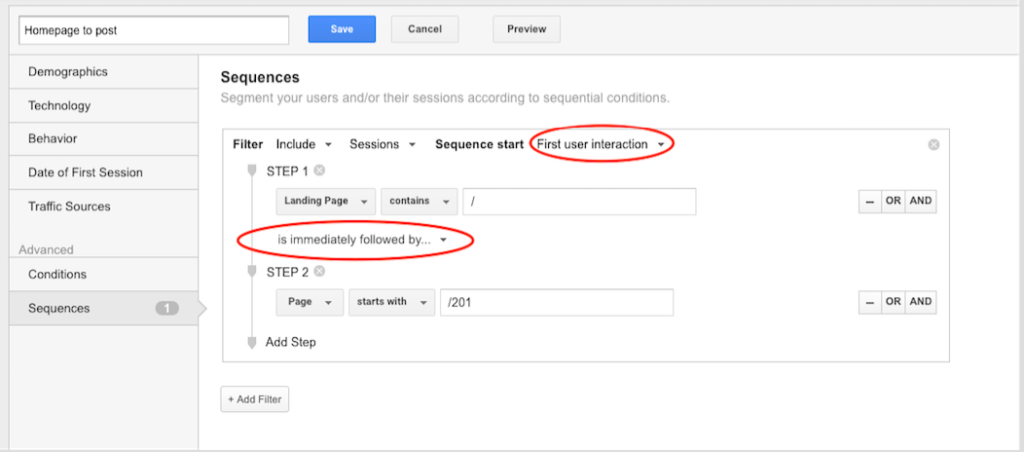
Every single setting on this screen is purposeful and affects the final results. The user sequences must start at their first interaction since we aren’t interested in visitors that are coming from other posts already for this analysis. By choosing “immediately followed by…” we ensure that the visitor is following this sequence 100%. Lastly, the page in Step 2 starts with “/201” to match the post permalink.
The category segment is nearly identical, except the pages in Step 2 start with “/category/”.
We’ll also create one “base” segment with only one step, with the only condition that the landing page is exactly “/”. This will give us additional context to the data.
The “information”:
Right off the bat, we find out that very few users are clicking onto the category navigation compared to clicking onto a post. Of the visitors that are hitting the homepage first, a very high percentage of them are clicking straight into a post though – which is a good thing! More on this in a bit.

Now for the information we’re really after – “Pages / Session”:
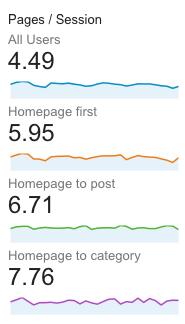
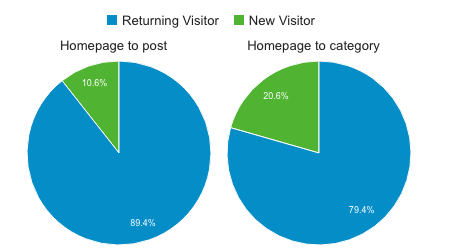
There’s our answer – users who go to a category page first access more pages per session than those who go from the homepage to a post (7.76 vs 6.71). But on this same screen, another chart shows something intriguing. Homepage visitors are more likely to be a new visitor if they go to the category navigation first:
So in summary, here is what we now know:
- Very few visitors are navigating from the homepage to the category pages compared to the posts
- Visitors who do click into the category navigation first access 1 additional page on average
Changes to explore:
As mentioned earlier, we want to focus on making changes that both better the user’s experience as well as increase pageviews for additional ad revenue. Additional pageviews might mean that they are having issues finding the content they want to see rather than enjoying content they actually like.
- Fixed header: We can explore and test having the header and category navigation fixed so it stays with you as you scroll. This would encourage perusing visitors to try one of the category pages if they’re looking for content.
- Add text to the category navigation: Right now, the categories are listed out in the header without any inviting text. By adding a words like “Explore:” or “Recent Updates:” before the category navigation, additional visitors may use the links and generate additional pageviews.
Next we can begin A/B testing these hypotheses and return with new data to explore. What kind of other changes would you explore for this site? Or what questions would you ask with a blog that has this kind of traffic?
—
Interested in having us explore these kinds of questions and investigations for your site? Reach out to us today.